This Visualizing the Data series, written by ICLEI Technical Director Mike Steinhoff, gives life to the greenhouse-gas emissions reporting numbers pulled from ICLEI USA’s flagship ClearPath tool. Hundreds of U.S. cities have used ClearPath to initiate greenhouse gas emissions inventories — allowing for a science-based approach to inform decision making and climate action planning. Read the full series in Toward 1.5 Degrees: ICLEI USA 2016 Annual Report.
Read Part 1: Putting the Protocols Into Perspective
Read Part 2: Taking Stock of City GHG Inventories
Read Part 3: City Planning Horizons
Read Part 4: Imagining Many Futures
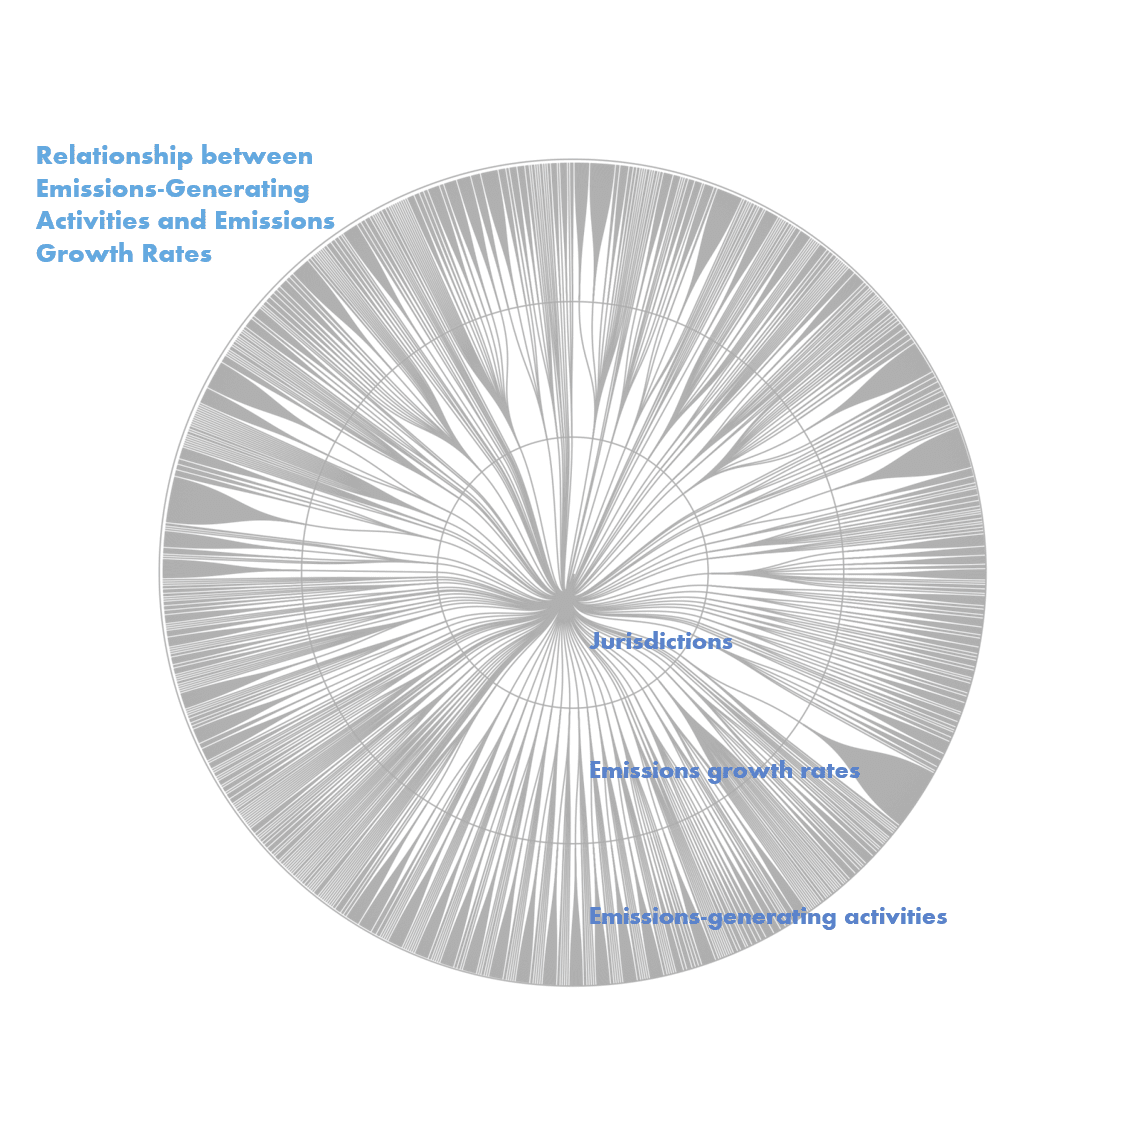
How emissions growth rates are applied is another aspect we can observe in the data created by ClearPath users. This dendrogram chart illustrates how some of those rates are used and re-used. Here, lines representing cities emanate from the inner ring. In the middle ring, each set of growth rates they’ve designated branch out. And the specific emissions-generating activities that experience those forecasted rates reside on the outer ring.
The fanning out between the inner and middle rings indicates cities that have developed many possible growth scenarios for the many different activities taking place in their communities.
Fanning out in the outer ring illustrates cities that are applying the same set of assumptions across many activities. Here is an example of how, when we look at patterns in how the ClearPath tool is being used, we can inform our plans to develop new resources. The ability of cities to make nuanced projections of emissions from different activities is an indicator of their ability to plan effectively to reduce those emissions. When those projections are reported to the carbonn Climate Registry, the world’s leading GHG reporting platform, they can be aggregated at a global scale to provide even more powerful insights.
We’re watching these and other trends in the data to identify needs and develop the resources to improve the capacity of all cities to consider future emissions-reductions trends that can drive change in their communities.
Read our full 2016 Annual Report for more ways cities are using science to inform climate action.