
This Visualizing the Data series, written by ICLEI Technical Director Mike Steinhoff, gives life to the greenhouse-gas emissions reporting numbers pulled from ICLEI USA’s flagship ClearPath tool. Hundreds of U.S. cities have used ClearPath to initiate greenhouse gas emissions inventories — allowing for a science-based approach to inform decision making and climate action planning. Read the full series in Toward 1.5 Degrees: ICLEI USA 2016 Annual Report.
Read Part 1: Putting the Protocols Into Perspective
Read Part 2: Taking Stock of City GHG Inventories
Read Part 3: City Planning Horizons
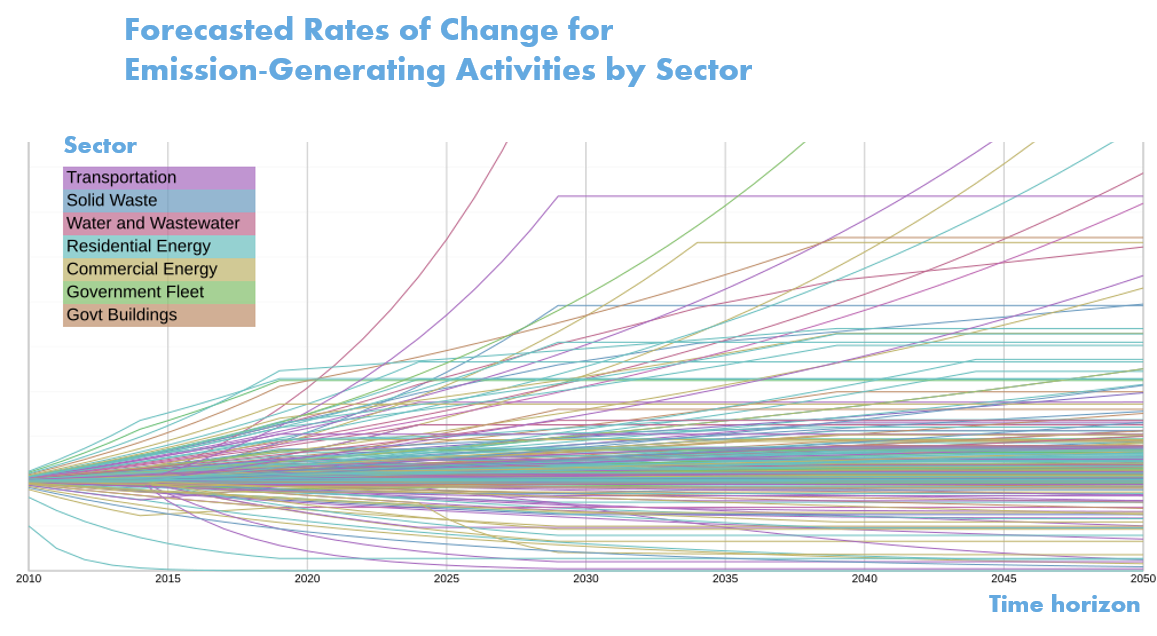
What do cities expect to happen under a business-as-usual pathway over the time horizons they are planning for? ClearPath’s Forecast Module allows users to create dynamic business-as-usual scenario projections for emissions-generating activities with independent rates of change. These can be applied to many different sources of greenhouse gas emission. Moreover, users can project some sources growing while others are declining naturally through market-driven changes, such as fuel switching from fuel oil to natural gas.
This illustration above shows the rates of change ClearPath users have specified to apply to emissions-generating activities in various sectors. For display, these were “normalized” to all begin at the same starting point. Keep in mind that emissions projected to grow very quickly from some activities may, in fact, be applied to very small sources within an inventory.
While outliers exist, it is clear that most users anticipate generally moderate growth in most areas under business as usual. As this dataset grows, we expect patterns to emerge, revealing an outlook for changes cities are projecting across different typologies and geographies. Data can even be aggregated globally, because ClearPath is linked to the ICLEI-managed carbonn Climate Registry, the world’s leading reporting platform for local climate action. This data can help inform context-appropriate mitigation actions that better target those areas where challenges appear greatest.
Read Part 5: Improving Resources with Data-Driven Insights
Read our full 2016 Annual Report for more ways cities are using science to inform climate action.