The ClearPath 2.0 Dashboard
Track and share your Climate Action Plan.
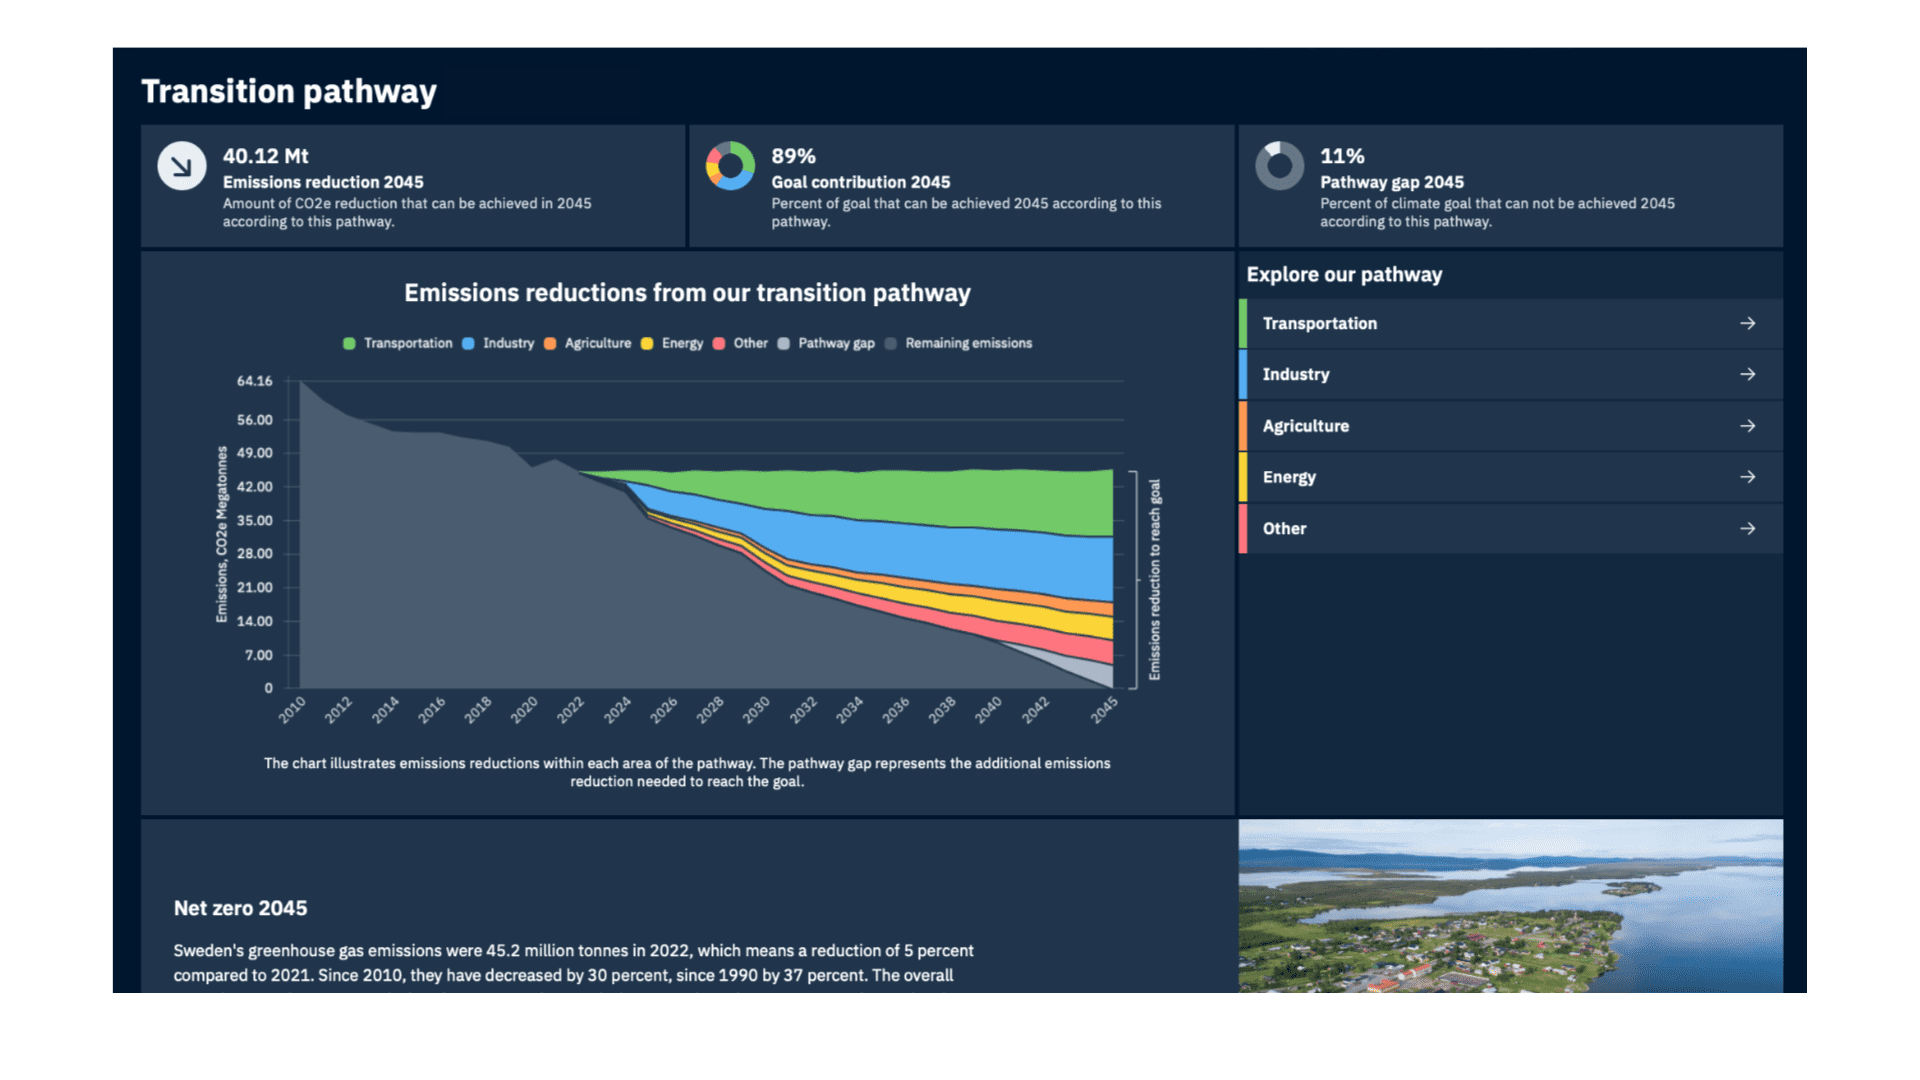
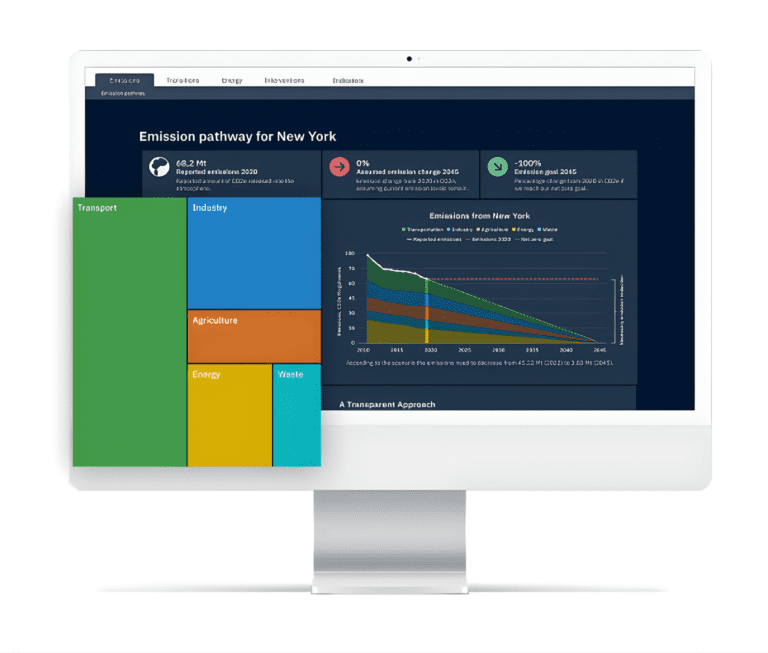
The ClearPath 2.0 dashboard turns your climate action plan into a living resource that speeds up and tracks progress, shares data, and keeps your community informed.
More than visualization–
Show your plan in action.
Every update you make inside ClearPath 2.0 flows directly into your dashboard – from adjusting targets to adding more actions. When your plan moves forward, your dashboard moves with it. Up-to-date, easy-to-use, and open for everyone to explore.
Core*: Full edit and view access for all four tabs internally and the ability to publicly publish the Emissions tab.
Dashboard Add-on: Unlocks the ability to publicly publish the other three tabs: Transitions, Interventions, and Indicators.
Learn more about the four Dashboard tabs below
*Comes with membership, Non-membership License, or Affiliation
| Emissions | Transitions | Interventions | Indicators | |
|---|---|---|---|---|
| Members/Non-member license | View internally Full public publishing | Full edit access View internally | Full edit access View internally | Full edit access View internally |
| Add-on | N/A | Public Publishing | Public Publishing | Public Publishing |
One Dashboard. Four Tabs.
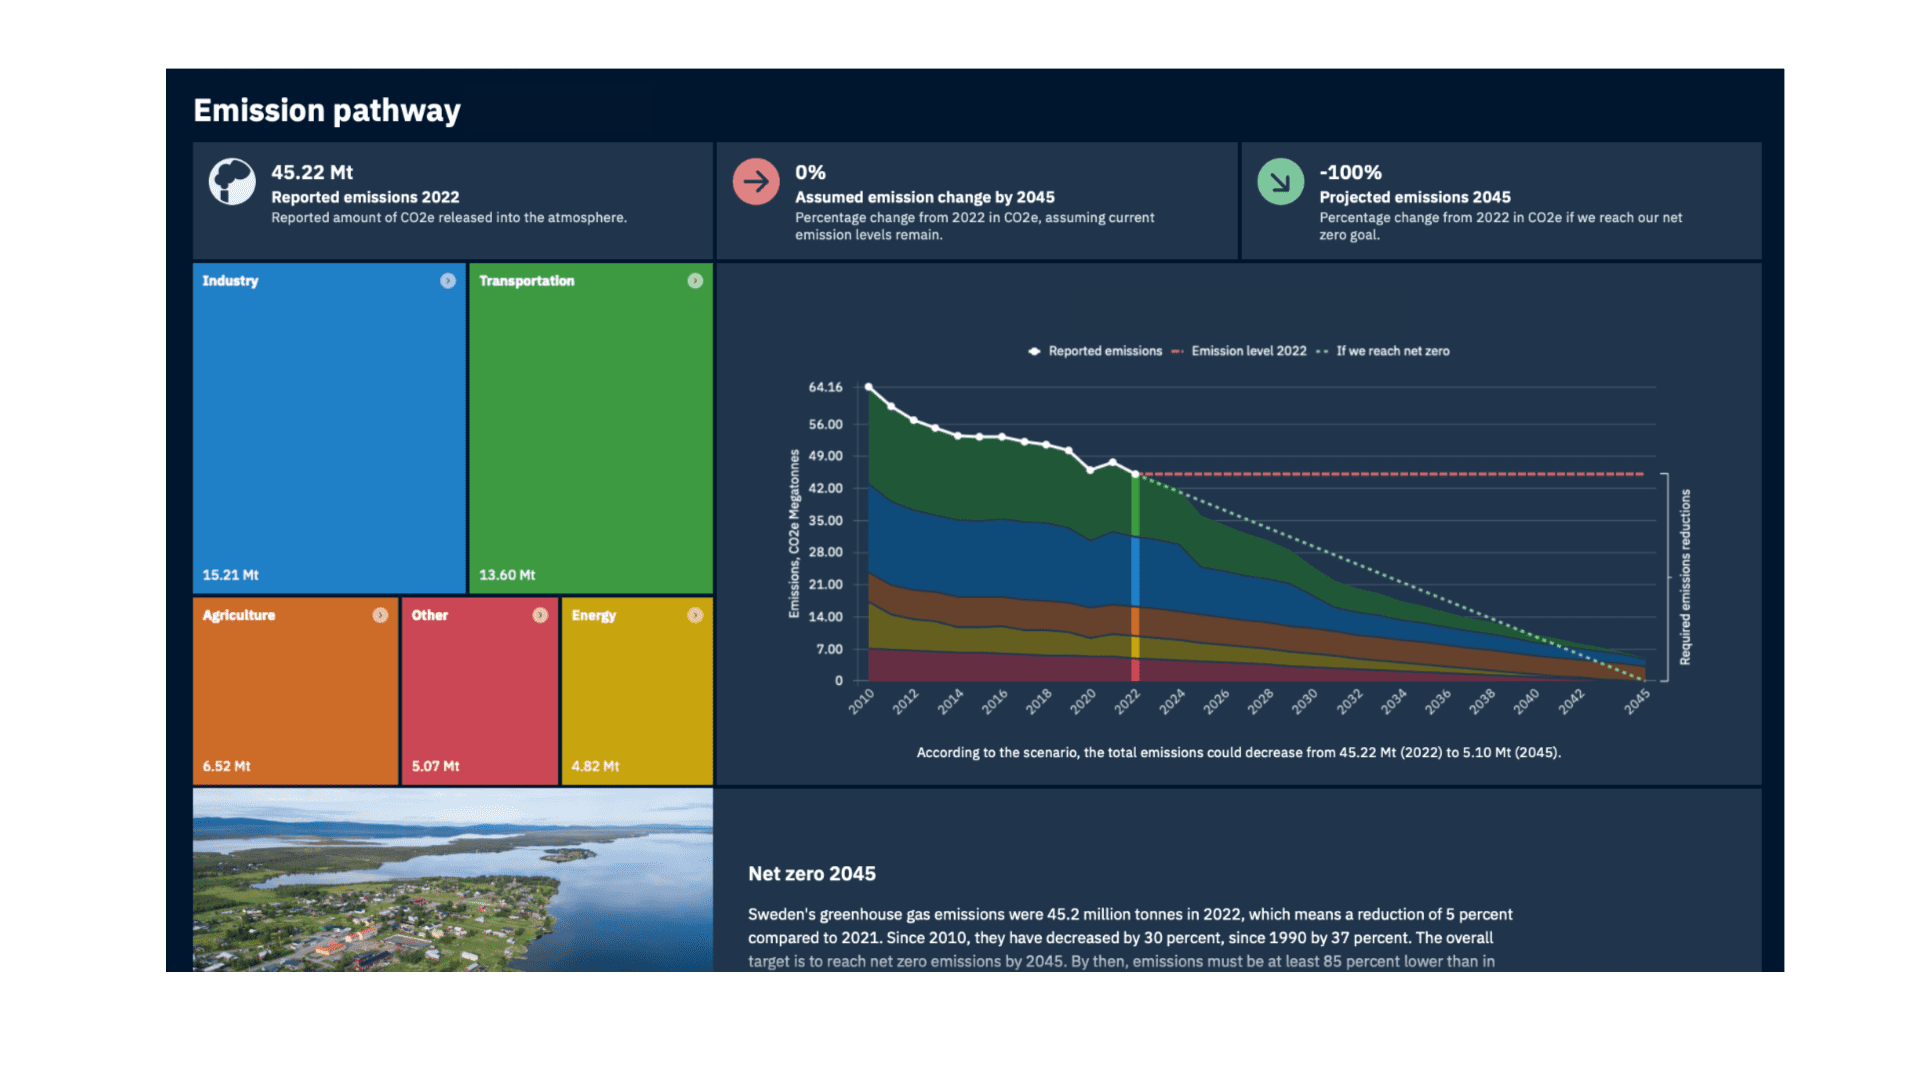
Track your Emissions trends and reduction targets using your Core Module; purchase the Dashboard Add-On to move from static reports to real-time climate action across all your work from Transitions to Interventions.
- Emissions
- Transitions
- Interventions
- Indicators
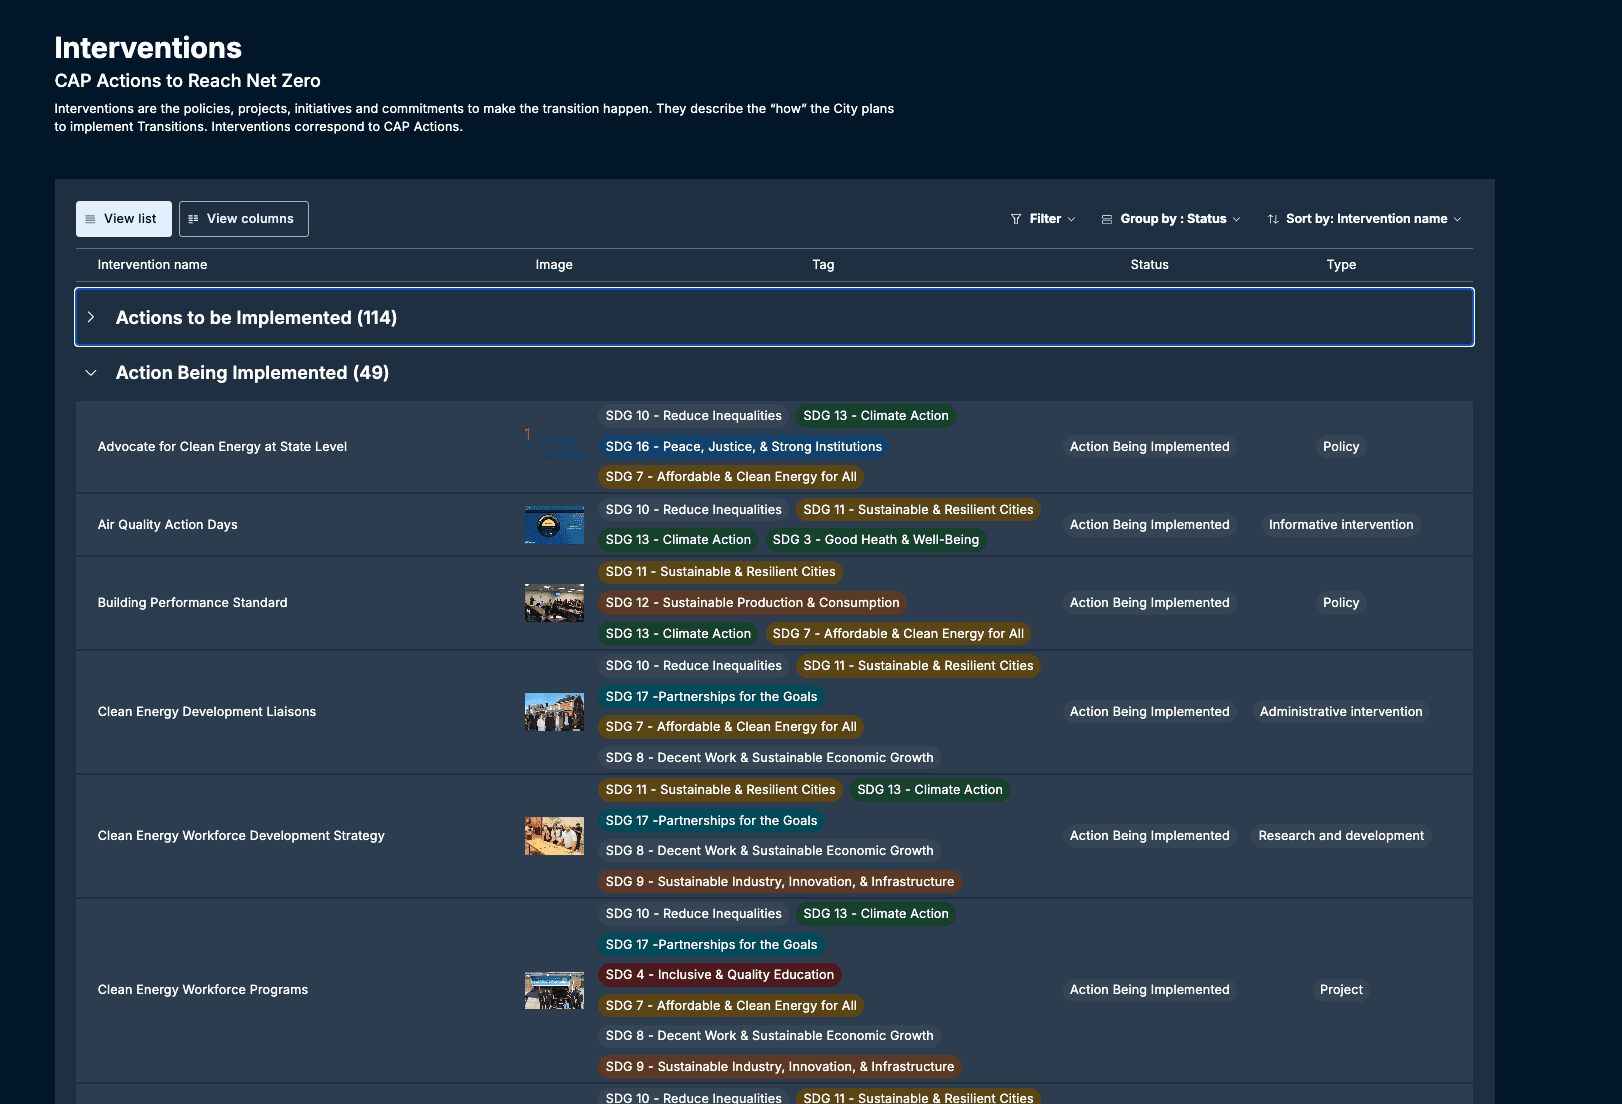
What actions are we taking?
Explore your catalog of policies and actions. Show what is planned, what is underway, and what has been completed.
Local governments can edit and view this tab internally under membership, but can publicly publicize the Interventions tab by purchasing the Dashboard Add-On.
Advance towards your goals with clarity.
The dashboard makes it easier to:
01
Communicate
Show where you are, your gaps, your actions, your progress. Your plan gets a public interface face that brings transparency to your progress.
02
Engage
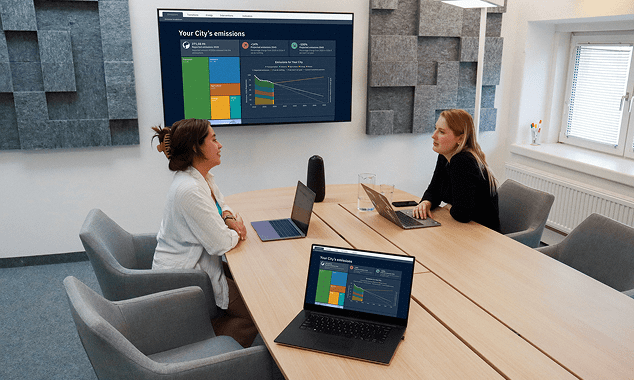
One place to anchor every conversation, from internal stakeholders to elected officials. Everyone sees the same picture.
03
Implement
Keep the momentum going with clear communications across departments. See exactly what’s moving, what’s stalled, and where you need to follow up.
04
Improve
Spot implementation gaps, run stakeholder consultations, and update the plan. The dashboard makes updates transparent and engaging.
“The dashboard helped us turn a 120-page climate action plan into something people could actually understand and connect with.”
— Carrie Whitlock
Long Range Planning Program Manager,
City of Elk Grove
Watch this short video to learn more.
ICLEI USA members and non-member licenses have access to view and publish the ClearPath 2.0’s Emissions dashboard. They may view the Transitions, Interventions, and Indicator dashboards internally, at no additional cost. Additional functionality, such as publishing additional dashboards for public consultation or communication, is available for purchase through the Dashboard Add-On.
Watch the video to explore what is included with membership and what is available through the Add-On.