
Features
Why ClearPath 2.0?
ClearPath 2.0 was developed in response to the growing needs of ICLEI USA members, incorporating powerful new features to empower local governments with the tools needed to develop data-driven climate strategies, track emissions reductions, and implement effective sustainability interventions. The platform offers:
- Integrated Functionalities: Seamlessly connect inventory data to scenario modeling and progress monitoring.
- Enhanced Interface: Modern, intuitive design simplifies navigation of complex tasks
- Dynamic Visualizations: Interactive graphs help uncover gaps, communicate insights and support decision-making.
- Collaborative nature: Easier collaboration across departments for alignment and accelerated action.
- Increased Efficiency: Centralized data handling and improved workflows avoid duplication of efforts
Integrated Functionalities
Full Interconnection of Data & Decisions
One of the most powerful upgrades is how data seamlessly flows between modules:
Real-time updates across the platform – Any modification in emissions data, parameters, or modeling choices is immediately reflected everywhere, preventing inconsistencies.
Modules dynamically pull needed data – Each section automatically incorporates relevant inputs from previous steps, eliminating redundant data entry.
Decision-aware functionality – If a change in one area affects another (e.g., adjusting a reduction measure that impacts cost estimates), the system accounts for it instantly, maintaining accuracy across the board.

Enhanced Interface
The Enhanced Interface in ClearPath 2.0 is a significant upgrade that improves usability by making navigation more intuitive, reducing confusion, and supporting users at different experience levels. Here’s a deeper dive into how these enhancements contribute to a smoother, more efficient workflow:
Improved Navigation & Reduced Confusion
Accordion-style collapsing: Users can choose to see as much or as little information as they need at a given moment in various modules. This is especially useful for those who need to toggle between high-level summaries and detailed emissions data without feeling overwhelmed.
Modern design with tabs and icons: Clearly labeled tabs and intuitive icons (e.g., settings, data inputs, reporting tools) allow users to quickly find what they need, reducing the time spent searching for features.
Interconnected buttons: Functions are linked logically, ensuring that users don’t get lost in unrelated sections.
Support for Users of All Experience Levels
Clear messaging and prompts: Well-placed buttons, explanations, and error messages help guide users through complex processes like emissions modeling or forecasting. This makes the platform more accessible for both seasoned professionals and those novice users.
Collapsible sections: Advanced users can keep a clean interface by hiding unnecessary fields, while beginners can expand sections to get additional context and guidance.
Logical workflow progression: The UI naturally leads users through the steps of an analysis without requiring them to memorize where everything is.
Efficiency Gains Through Modernization
Streamlined design: A modern UI reduces cognitive load, meaning less time spent figuring out how to use the tool and more time analyzing data.
Quick access to settings and configurations: Icons for settings, parameters, and configuration make it easy to adjust preferences without disrupting workflow.
Consistency across interfaces: All modules follow a standardized design logic, users don’t have to relearn navigation when switching between different modules.
Dynamic Visualizations
Comprehensive Visuals Across Modules
The platform provides visual tools that dynamically respond to user inputs and allow for scenario analysis:
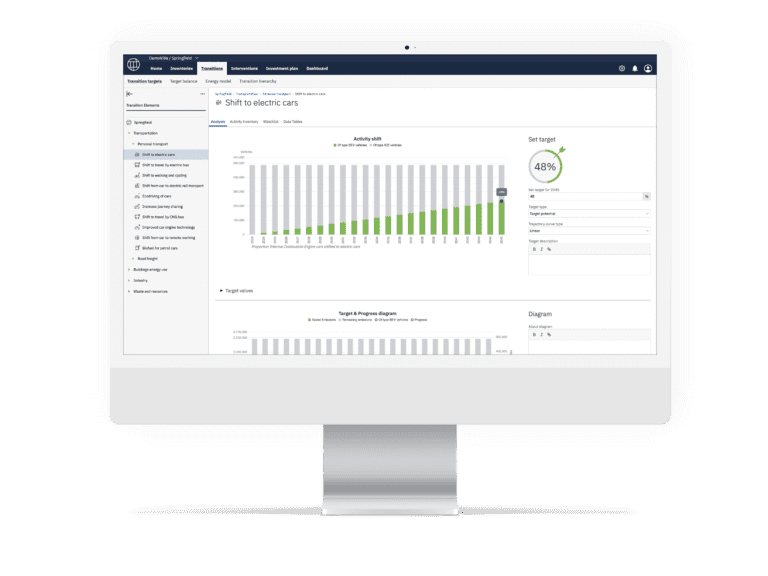
Emissions Abatement & Transition Targets – Users can track year-by-year progress, ensuring that their planned interventions align with long-term climate goals.
Progress Monitoring – Clear visual cues indicate how well targets are being met, helping users adjust strategies as needed.
Historical Data Comparisons – Users can see how emissions have evolved over time, gaining context for future planning.
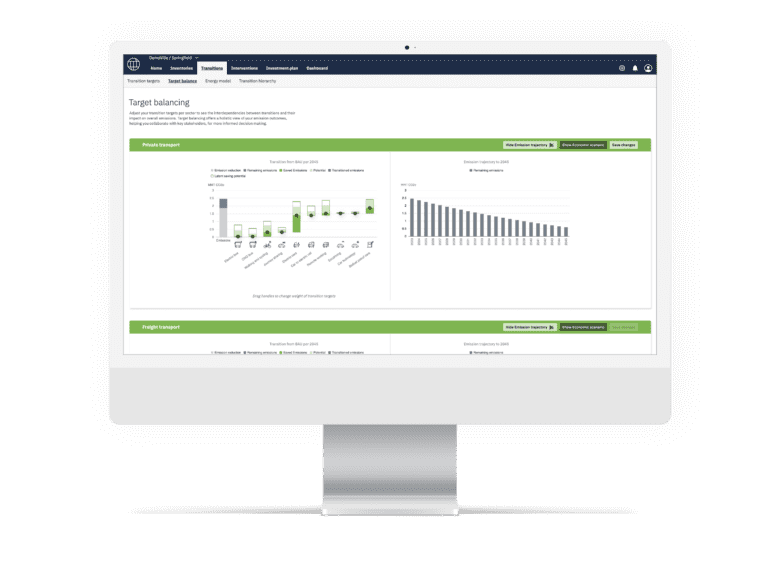
Target Balancing – Users can adjust transition targets dynamically, displaying side-by-side comparisons to show how one transition affects another in real time.
Dashboard Capabilities
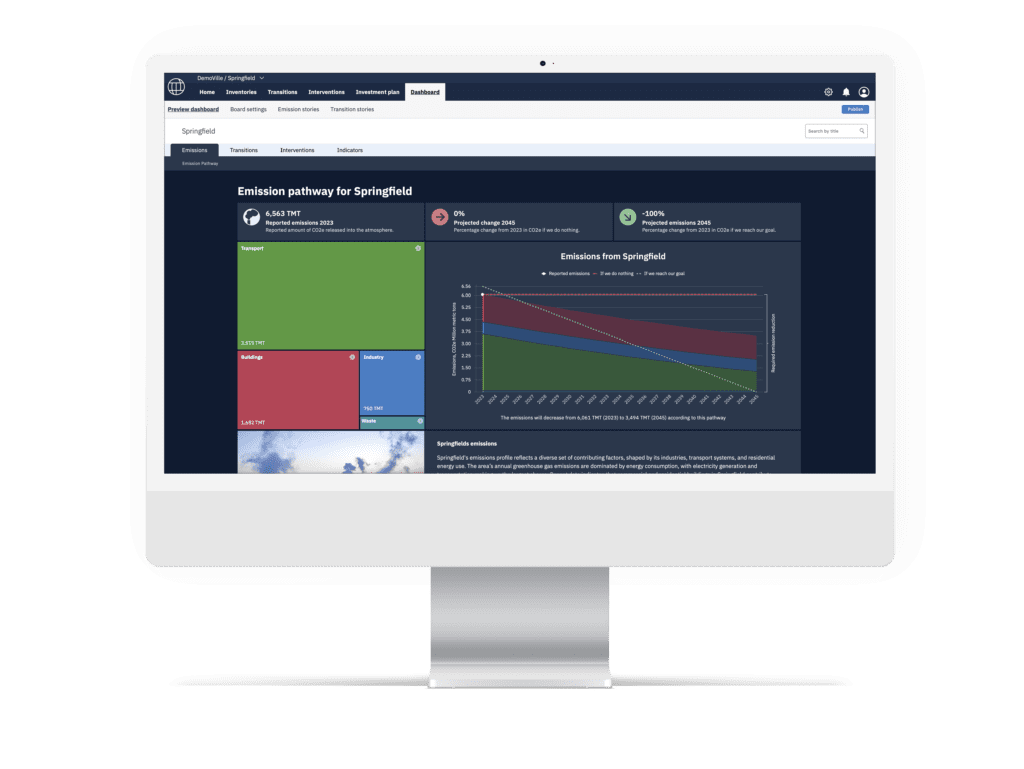
The platform includes a publishable dashboard that provides an interactive and shareable view of emissions data and transition progress, with abilities such as:
Displaying historical, current, and projected emissions across sectors and subsectors.
Drill-down functionality to explore specific areas of emissions and activities.
Interactivity for users and external viewers to engage with data.
Visualization of planned transitions and key interventions that support emissions reductions.
Tracking progress toward emissions goals and illustrating changes over time.
Real-Time Interaction & Extraction
Dynamic Updates – As users adjust sliders, toggle options, or input new data, the visualizations immediately update, providing instant feedback on the impact of changes.
Side-by-Side Comparisons – Users can see multiple transitions at once, assessing trade-offs and optimizing decisions.
Easy Extraction – Charts, graphs, and reports can be easily extracted for reporting, presentations, or stakeholder engagement.
Collaborative Nature
ClearPath 2.0 is built for seamless collaboration, allowing staff, stakeholders, and departments to work together efficiently with real-time updates, clear role assignments, and improved data-sharing capabilities.
Multi-User Access with Controlled Permissions – Account administrators can manage access levels, ensuring that the right people can view, edit, or publish relevant data while maintaining security.
Real-Time Collaboration – Staff can work simultaneously, with changes updating instantly for all users, preventing version conflicts or outdated information.
“Watch List” for Task Management – Users can be assigned to specific transitions and interventions, making responsibilities clear and ensuring timely updates on critical actions.
Enhanced Data Sharing – Departments and teams can easily output and share data tables with other users, streamlining coordination and reporting.
Notes & Data Logs for Transparency – Inventory and modeling inputs include notes sections and update logs, allowing users to see who made changes, when they were made, and any relevant comments for future reference.
Increased Efficiency
All the enhancements in interface design, integrated functionalities, dynamic visualizations, and collaboration tools come together to create a platform that is more efficient than ever before. By reducing redundancy, automating updates, and streamlining workflows, ClearPath 2.0 allows users to focus on decision-making rather than manual data management.