ClearPath 2.0 brings everything local governments need for climate action into one user-friendly platform. It helps local governments track emissions, plan for the future, and engage with collaborators, all while using data to drive smart decisions. With these tools, local governments can move from planning to action and create lasting, sustainable change.
Local governments use ClearPath 2.0 to:
Track and report emissions
Model transition scenarios
Set and refine targets
Design and take action
Visualize data and track progress
Create fundable projects
ClearPath offers the following features to support your climate action journey:
Move from Planning to Adaptive Implementation
ClearPath 2.0 is designed around the Transition Journey, a structured, iterative approach that helps communities move from planning to real-world implementation. The real value lies in its adaptability and accountability. Local governments can continuously refine their strategies based on real-world data, ensuring long-term success.
ClearPath 2.0 supports the journey in the following ways outlined below.
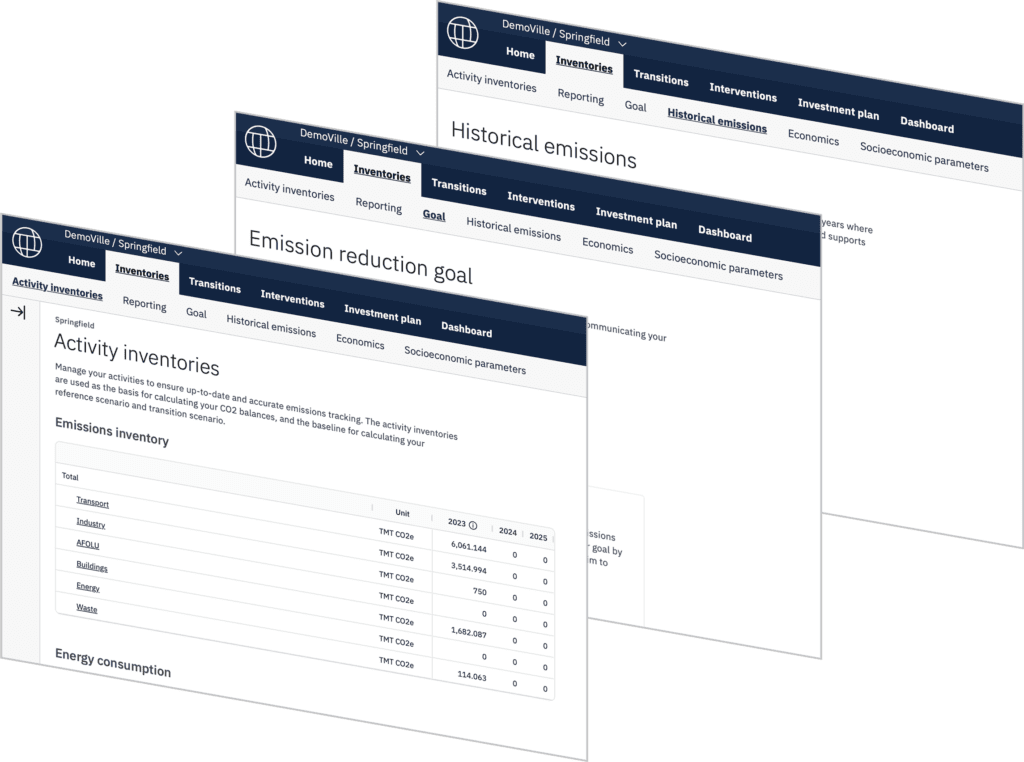
Lay the Foundation
Start strong with the Inventories tab, where local governments can track emissions across sectors, set science-backed reduction goals, and set a business-as-usual forecast for comparison. With seamless data export and global reporting standards, ClearPath 2.0 ensures local governments’s climate and sustainability actions are grounded in reliable data and ready for transparency.
Comprehensive emissions inventories - Users can track emissions with detailed sector-based inventories, historical data, and socioeconomic parameters.
Emission reduction goals - Users set science-backed reduction targets, ensuring alignment with long-term climate strategies.
Reference scenario modeling - Users identify goals and compare planned interventions against expected emissions trends.
Seamless data import, export & reporting - Users can upload inventory data and generate structured reports aligned with global climate standards, ensuring compliance and transparency.
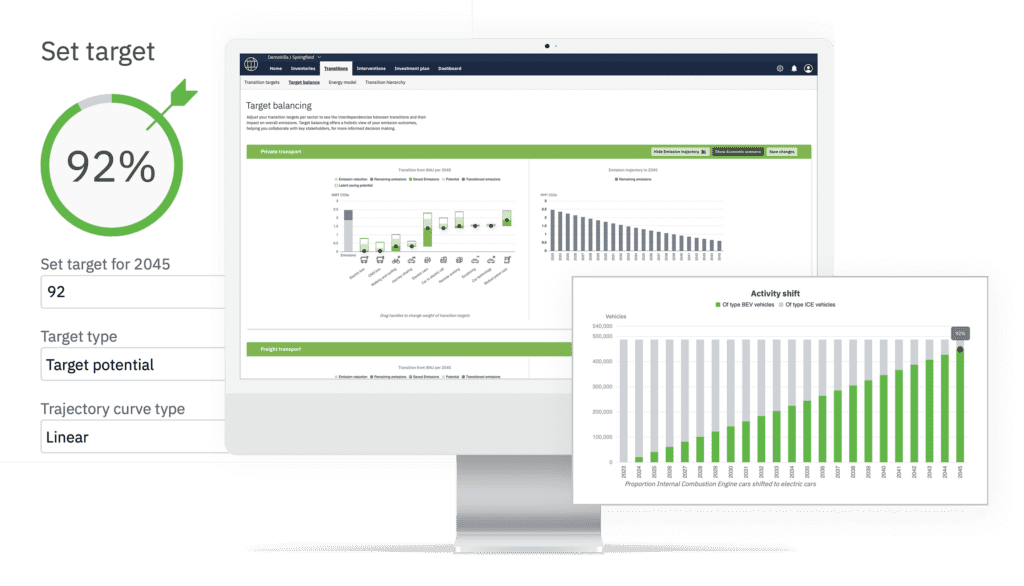
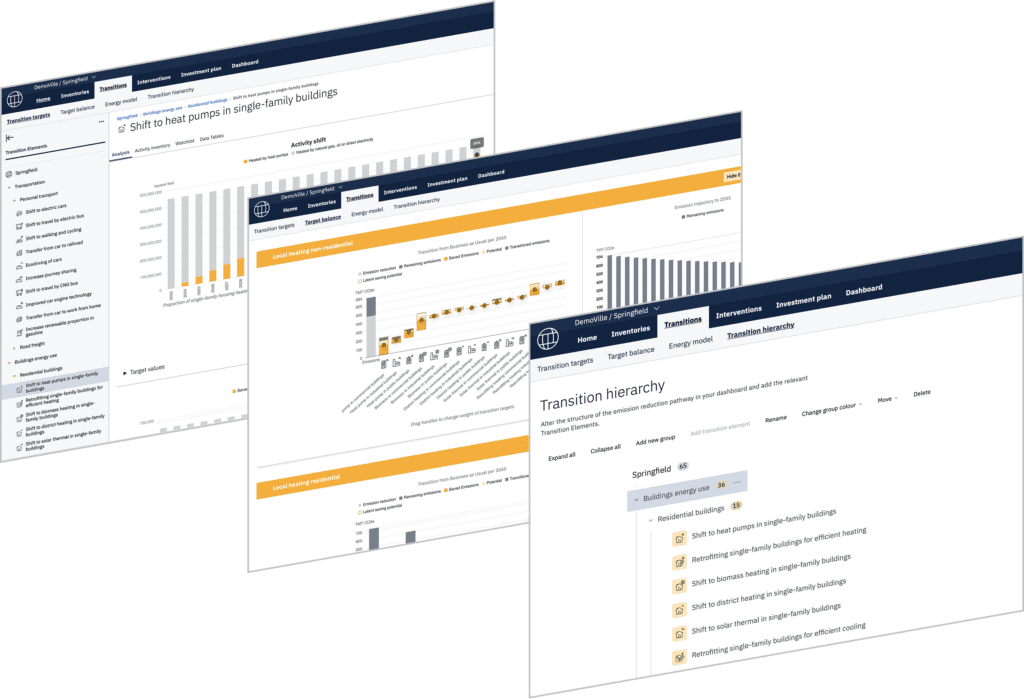
Set Targets
The Transitions tab lets users define climate and sustainability actions with clear, measurable goals. The flexible system refines actions, sets realistic annual goals, and shows how each transition impacts progress.
Transition hierarchy - Users can select the most relevant Transition Elements, structured by sector and subsector, to reflect local priorities.
Target setting - Users can define annual emissions reduction rates and forecast the real-world impact of each Transition Element.
Target balancing - Users can adjust transition targets dynamically, displaying side-by-side comparisons to show the ripple effects of how one transition affects another, in real-time.
Energy balancing – The Add-on energy model allows users to understand their future electricity and district heat demand based on your Transition targets and determine which energy sources (supply) you want to utilize to meet that demand.
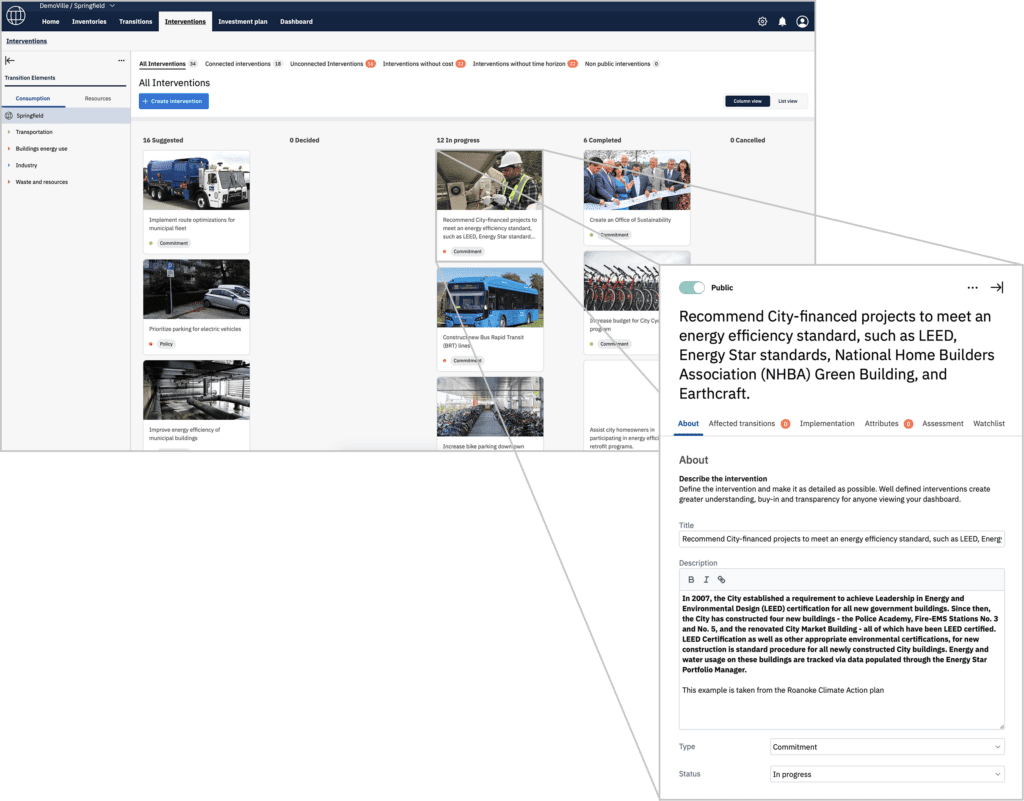
Take Action
The Interventions tab turns plans into action. Local governments define and track policies, programs, and investments to drive the shift toward low-carbon solutions. Linking interventions to specific Transition Elements directly measures their impact on emissions reductions.
Intervention planning & tracking – Users can define the specific policies, projects, and investments that will accelerate the shift toward low-carbon alternatives.
Intervention impact assessment - Users can link interventions to specific Transition Elements, tracking how they directly influence emissions reductions.
Sector-wide alignment - Users can ensure that interventions work together across transport, energy, buildings, and industry for system-wide impact.
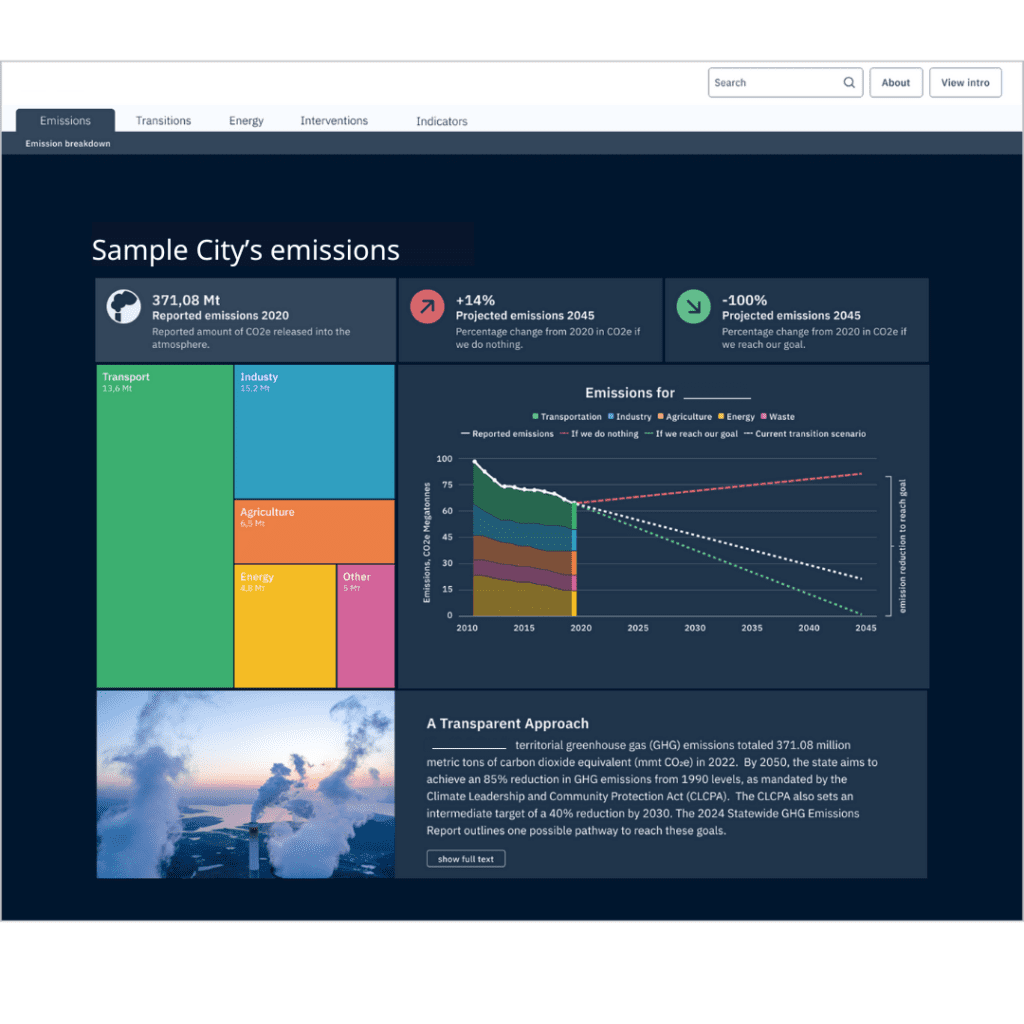
Track Progress
Stay on course with the Dashboard, which provides real-time insights into a community’s climate and sustainability action progress. Dynamic visualizations and key performance indicators (KPIs) track emissions reductions, support community engagement, and assess the effectiveness of interventions.
Monitor progress with key indicators - Use Transition Indicators and KPIs to track emissions reductions and assess the impact of interventions over time.
Engage stakeholders with visual storytelling - Users can communicate their climate progress through clear, data-driven visualizations, making climate action accessible to decision-makers and the public.
Assess interventions to refine future strategies - Users can analyze progress trends to identify what’s working, adjust plans, and make data-driven decisions for the next phase of implementation.