![]() This Visualizing the Data series, written by ICLEI Technical Director Mike Steinhoff, gives life to the greenhouse-gas emissions reporting numbers pulled from ICLEI USA’s flagship ClearPath tool. Hundreds of U.S. cities have used ClearPath to initiate greenhouse gas emissions inventories — allowing for a science-based approach to inform decision making and climate action planning. Read the full series in Toward 1.5 Degrees: ICLEI USA 2016 Annual Report.
This Visualizing the Data series, written by ICLEI Technical Director Mike Steinhoff, gives life to the greenhouse-gas emissions reporting numbers pulled from ICLEI USA’s flagship ClearPath tool. Hundreds of U.S. cities have used ClearPath to initiate greenhouse gas emissions inventories — allowing for a science-based approach to inform decision making and climate action planning. Read the full series in Toward 1.5 Degrees: ICLEI USA 2016 Annual Report.
In its three years of existence, ClearPath has accumulated a vast quantity of data. At the end of 2016, there are some 40,000 individual inventory records in the tool. That may seem like the kind of dataset that would tell us a lot about the performance of cities. However, only about half of those are marked “Official”; with the remaining being a combination of cloned inventories, test records, and training data. Those are further split between government operations and community scale inventories and divided among 119 different emissions generating processes covered in the tool as well as countless different combination of calculation methods, fuel types, and other differences.
After all those are separated out, the number of observations on a particular process across cities is small enough that drawing major conclusions from it at this time is difficult. That said, we believe we have the richest such dataset available and it grows every day. As we continue to watch this resource grow, we’re learning not only about the performance of cities, but the ways in which people enter data and interact with the tool.
As we continue to develop new resources, ICLEI-USA will leverage that information to refine our program offerings and support the work of cities better where we see gaps. Below are a few observations drawn from some of the more aggregate datasets in the tool. Each one poses new deeper questions that we’ll be continuing to explore in 2017.
Putting the Protocols into Perspective
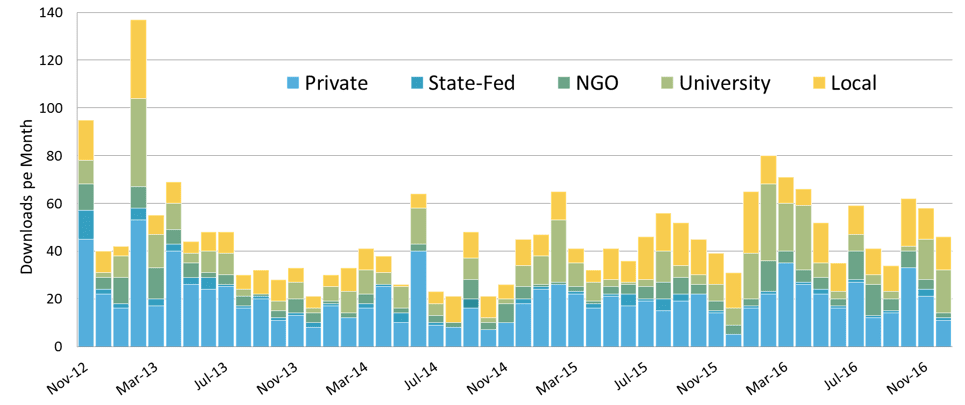
U.S. Community Protocol Downloads
At the basis of all our work are protocols. The chart above illustrates monthly downloads of the U.S. Community Protocol (USCP) since its launch (omitting more than 500 downloads in October of 2012 for purposes of scale). In 2016 —a year dominated by cities aiming to fulfill the requirements of the Global Protocol for Community-Scale Emissions Inventories — the USCP saw its greatest number of annual downloads ever. This document is a vital tool for describing not only methods for performing inventories specifically within the U.S. context, but also for guiding users through compiling an inventory that supports their own goals as a community. What else is clear is that it is not only local governments who rely on this resource — a great many professionals and students learn from and use this document as well.
Putting the protocol into action is a big lift and ClearPath is built for collaboration to complete that work. Within the tool, individual users can work with many communities and communities can have many users. The visualization to the right illustrates the many links between the individual users on the platform and the cities they are working with. Each color division on the left represents a user.
![]()
Mapping the ClearPath ‘power users’
Therefore, large blocks of one color showcase “Power Users” — consultants, regional agencies, and NGO supporters who work with many communities. On the right side are the city accounts that each user is connected to. People working together, it’s a beautiful thing.
Read Part 2: Taking Stock of City GHG Inventories
Read Part 3: City Planning Horizons
Read Part 4: Imagining Many Futures
Read Part 5: Improving Resources with Data-Driven Insights
Read our full 2016 Annual Report for more ways cities are using science to inform climate action.