 This Visualizing the Data series, written by ICLEI Technical Director Mike Steinhoff, gives life to the greenhouse-gas emissions reporting numbers pulled from ICLEI USA’s flagship ClearPath tool. Hundreds of U.S. cities have used ClearPath to initiate greenhouse gas emissions inventories — allowing for a science-based approach to inform decision making and climate action planning. Read the full series in Toward 1.5 Degrees: ICLEI USA 2016 Annual Report.
Read Part 1: Putting the Protocols Into Perspective
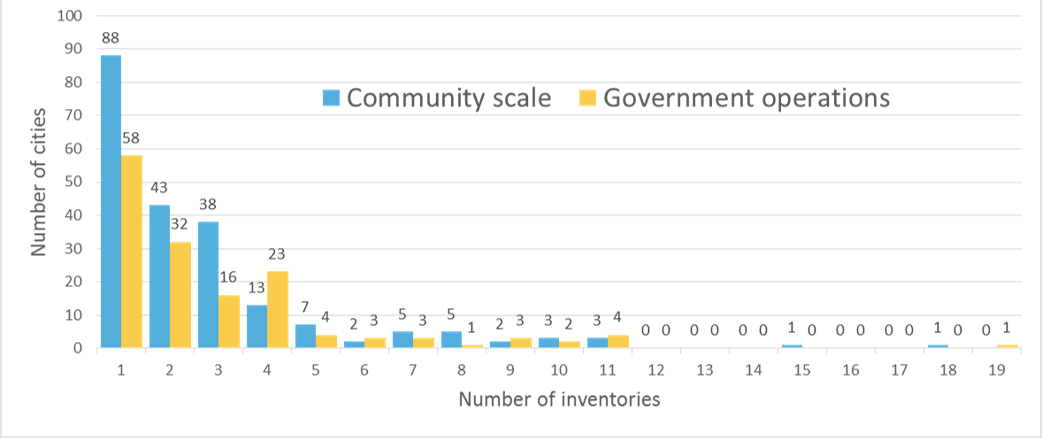
Number of cities with multiple greenhouse gas inventories
Our members and other constituents have been busy: Undertaking an inventory requires significant effort. Many of them have completed inventories using ClearPath. More impressive is the number of communities that have accomplished this task two, three, 10, or even 19 times over (as indicated in the graph above)! It is encouraging to see the number of communities that are institutionalizing regular tracking of emissions inventories. This is a good indication that, increasingly, these figures are being used as key indicators of community performance.
The span of years covered by some users is also impressive. When we launched ClearPath in 2013, we were quite proud of delivering a tool that would allow cities to begin developing trends within the tool for their inventories going forward. We were delighted to then see the number of users who went back and re-created their historical inventories — in some cases, stretching back to 1990 in order to finally house their data all in one place.
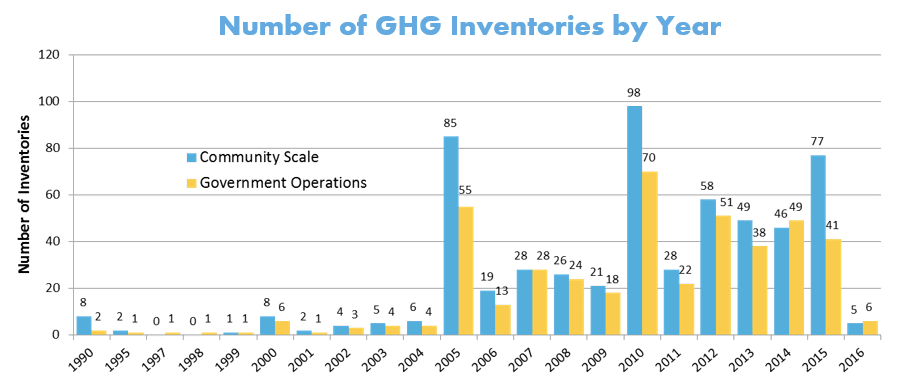
Number of GHG inventories by year
It is also interesting to observe in the chart below the relative dominance of inventories in 2005, 2010 and, to a lesser extent, 2015. It would appear that the intervening years are creeping up again as this activity is becoming a regular exercise for many. (Even as we just begin 2017, there are already a handful of communities working to develop 2016 inventories.)
Read Part 3: City Planning Horizons
Read our full 2016 Annual Report for more ways cities are using science to inform climate action.